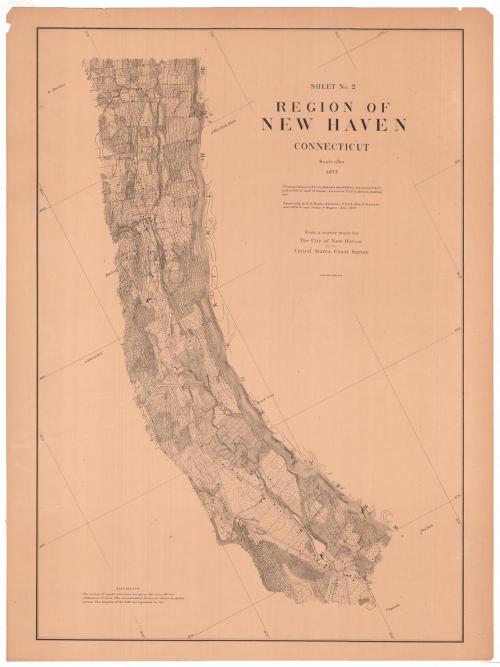
Sheet Number 2. Region of New Haven, Connecticut
MakerMade by
United States Coast Survey
(American, founded 1807)
SurveyorTriangulation by
Richard Meade Bache
(American, 1830 - 1907)
SurveyorTriangulation by
Horace Andrews
(American, 1852 - 1945)
SurveyorTriangulation by
Edward Goodfellow
(American, about 1828 - 1899)
SurveyorTopography by
Richard Meade Bache
(American, 1830 - 1907)
SurveyorTopography by
James P. Bogart
(1852 - 1903)
SurveyorTopography by
William F. Downer
(American, 1850 - 1923)
PrinterLithographed by
Julius Bien
(1826 - 1909)
Date1877
MediumPhoto lithography; black printer's ink on paper
DimensionsPrimary Dimensions (image height x width): 30 1/8 x 21 1/8in. (76.5 x 53.7cm)
Sheet (height x width): 32 1/8 x 24in. (81.6 x 61cm)
ClassificationsGraphics
Credit LineConnecticut Museum of Culture and History collection
Object number2012.312.216.3
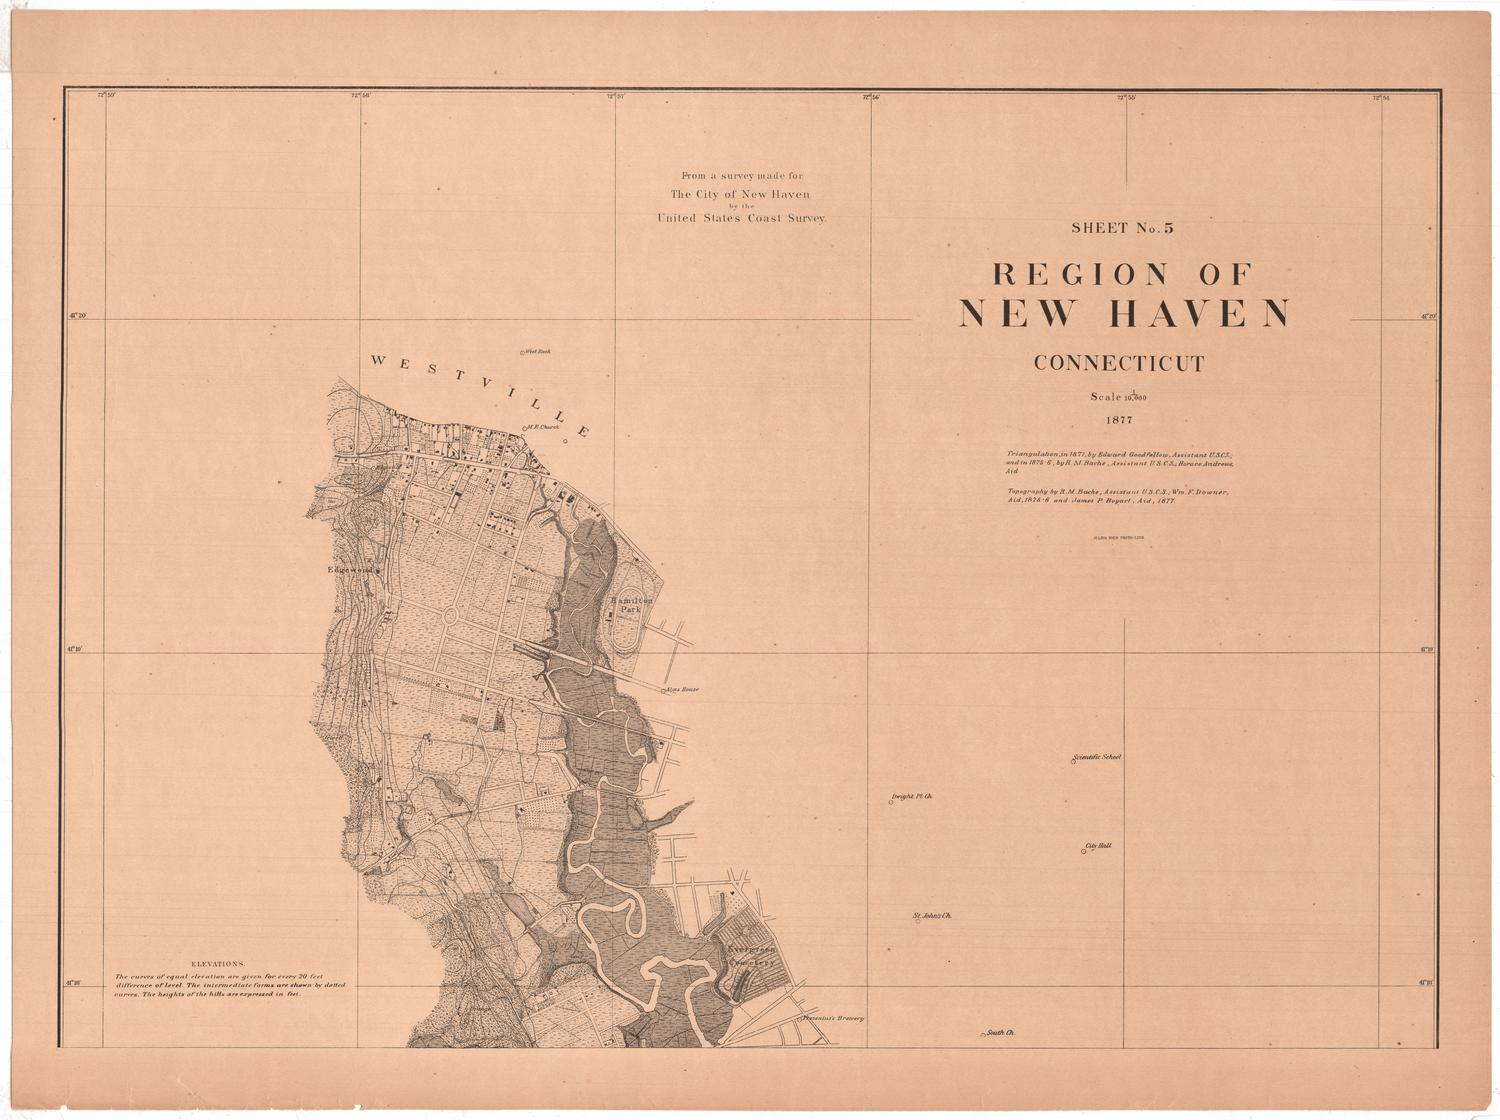
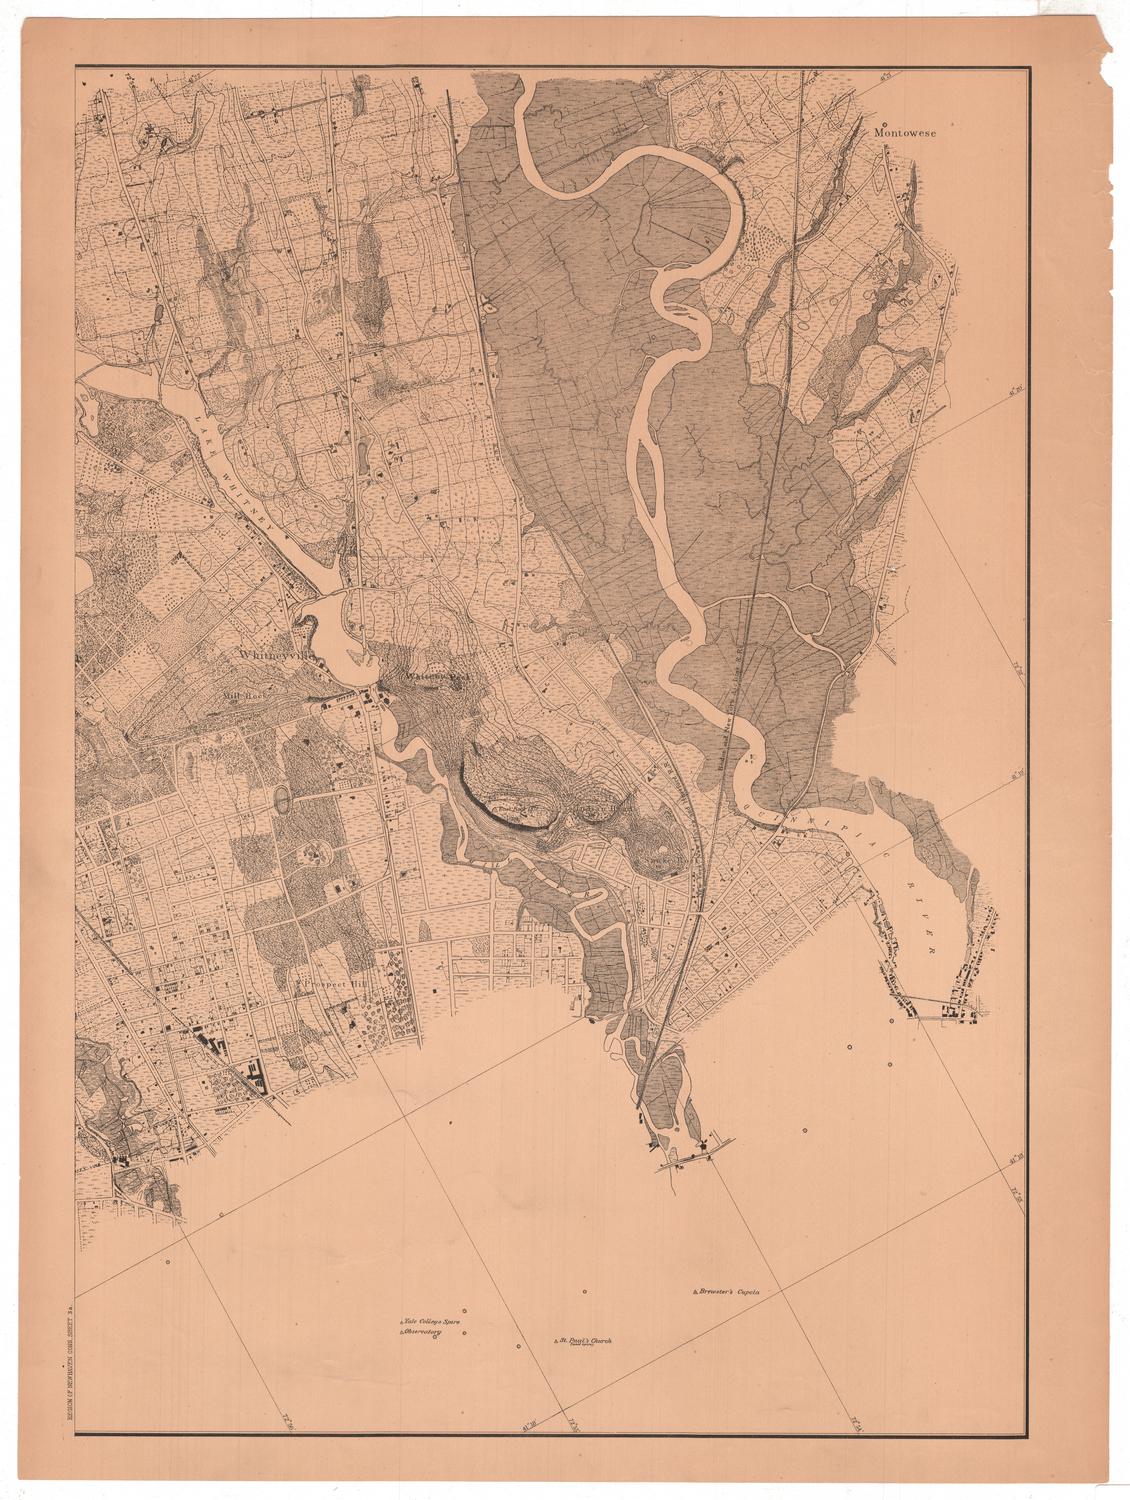
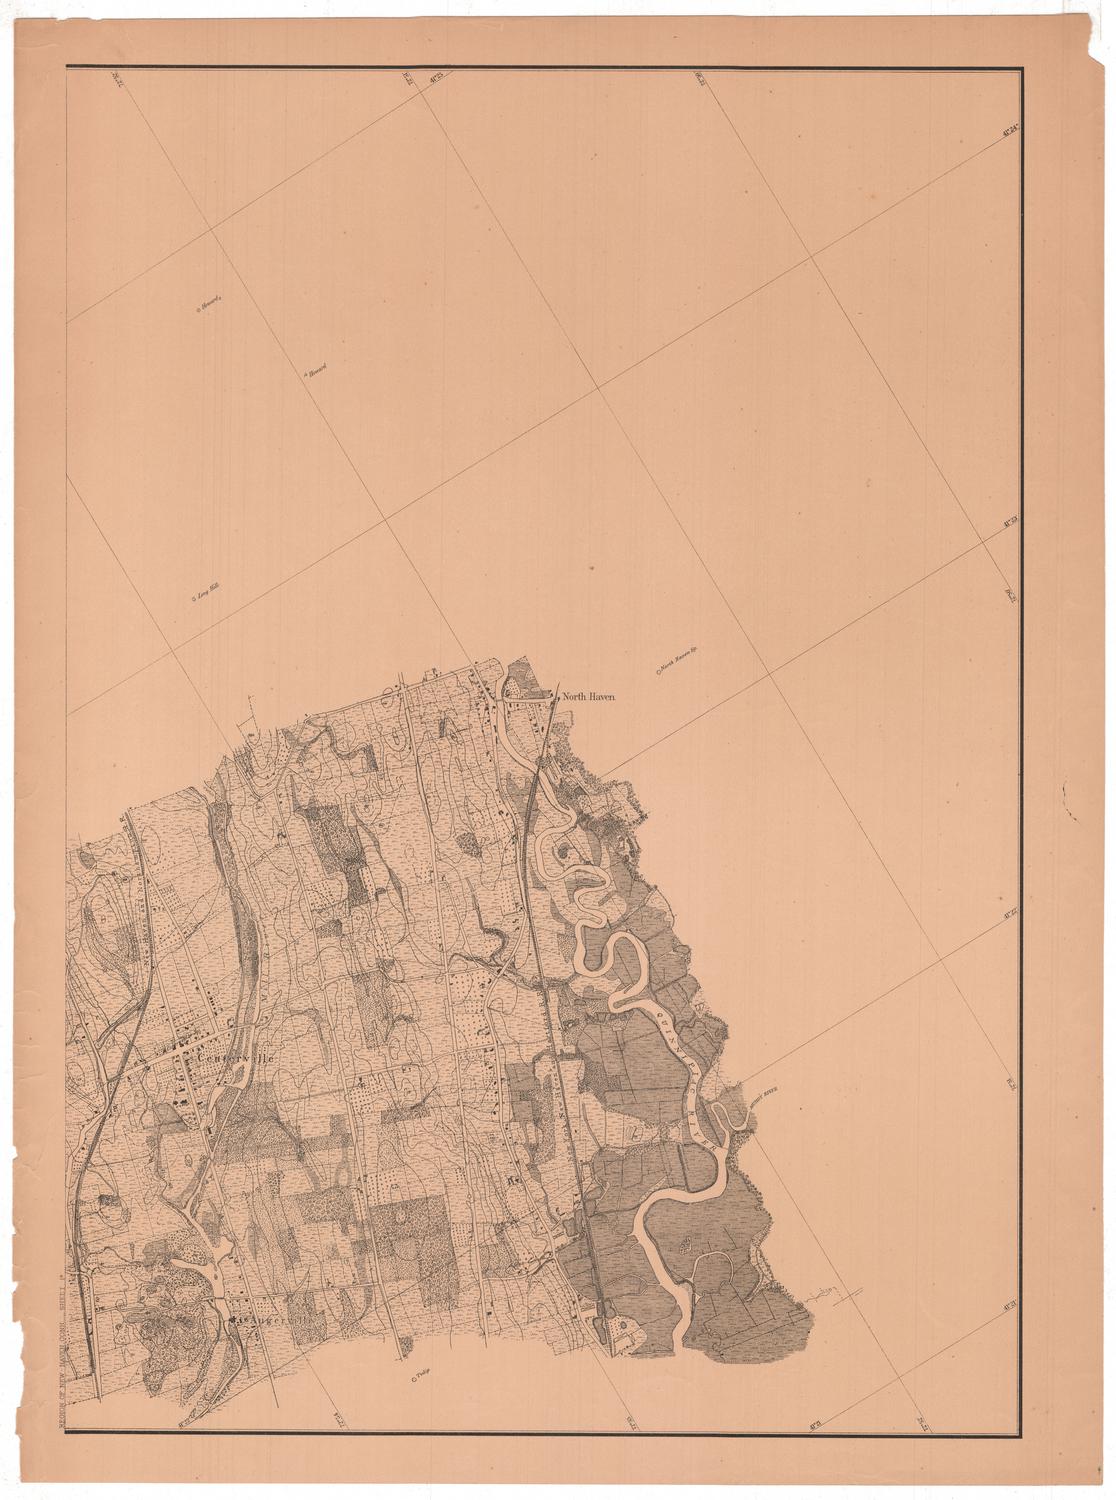
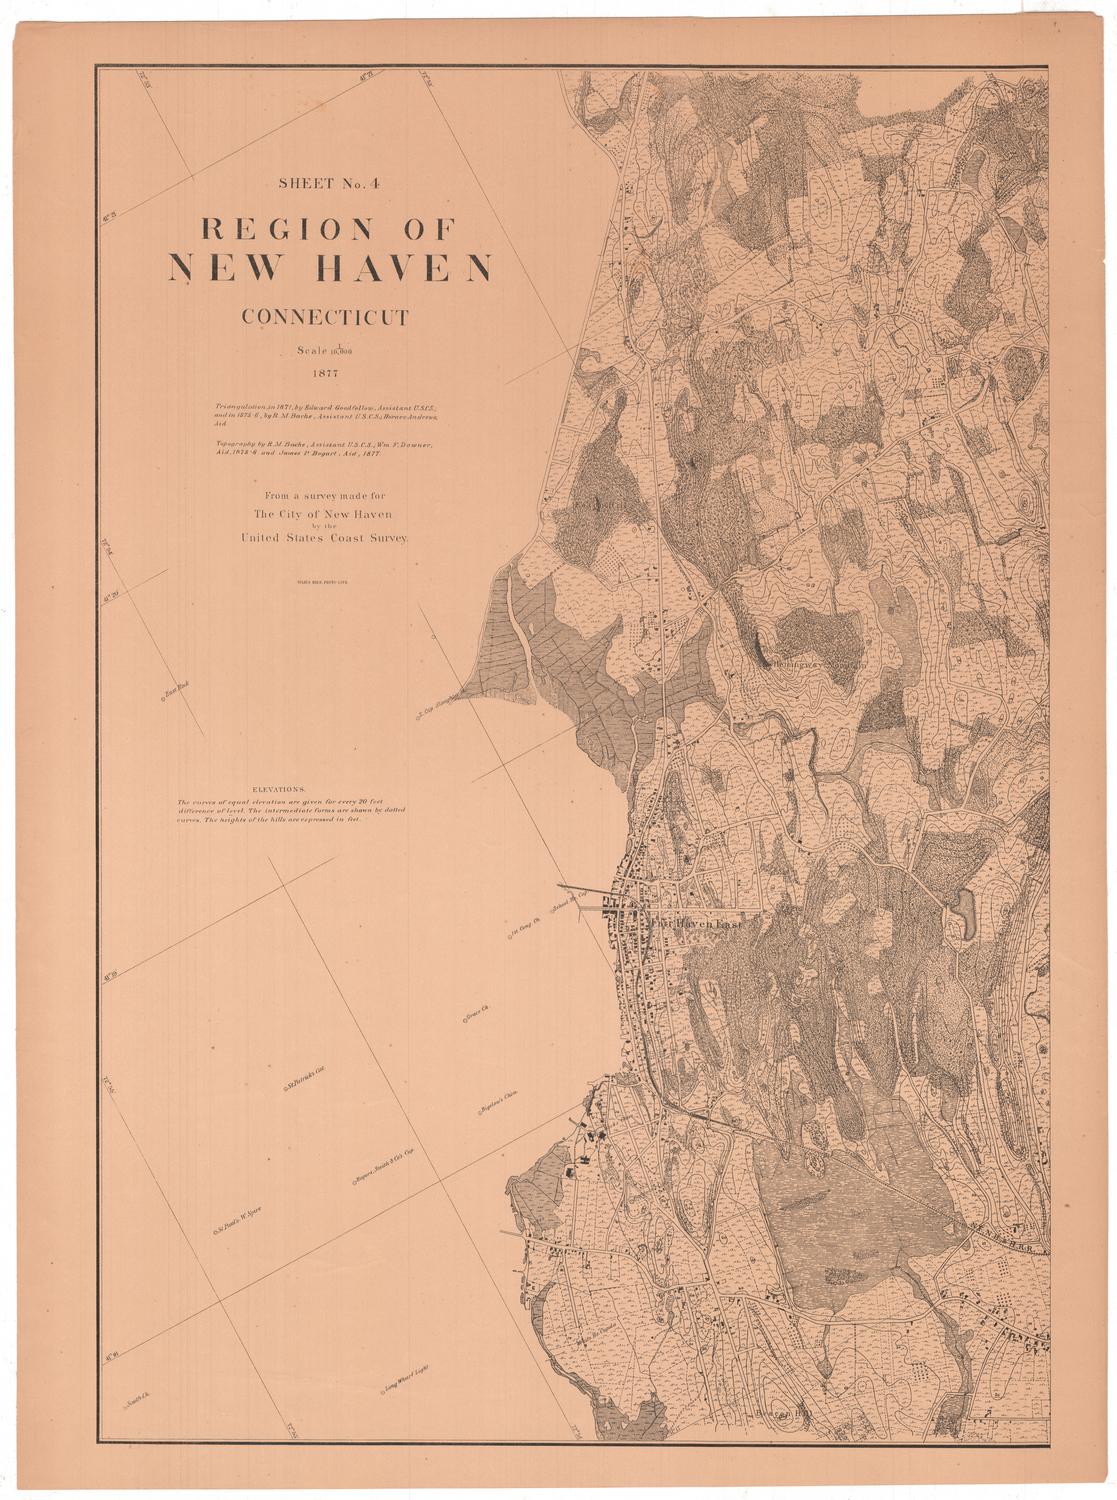
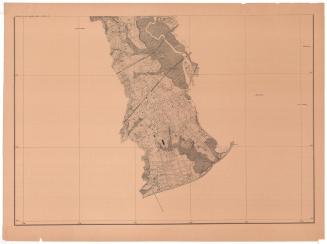
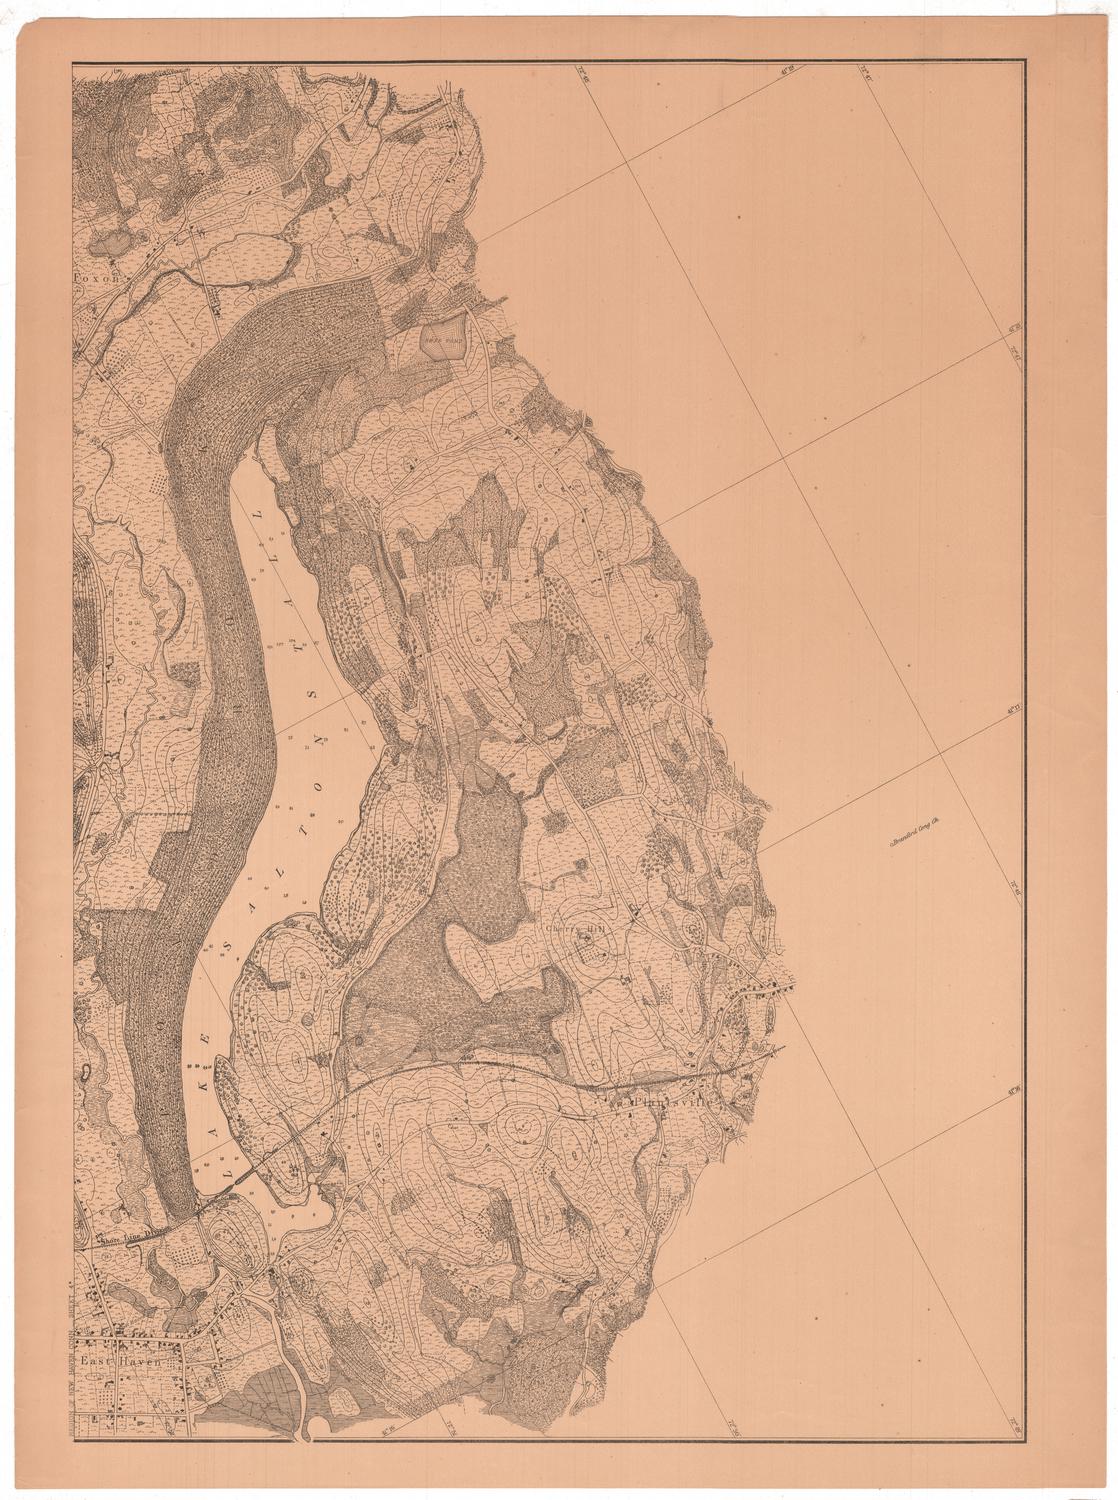
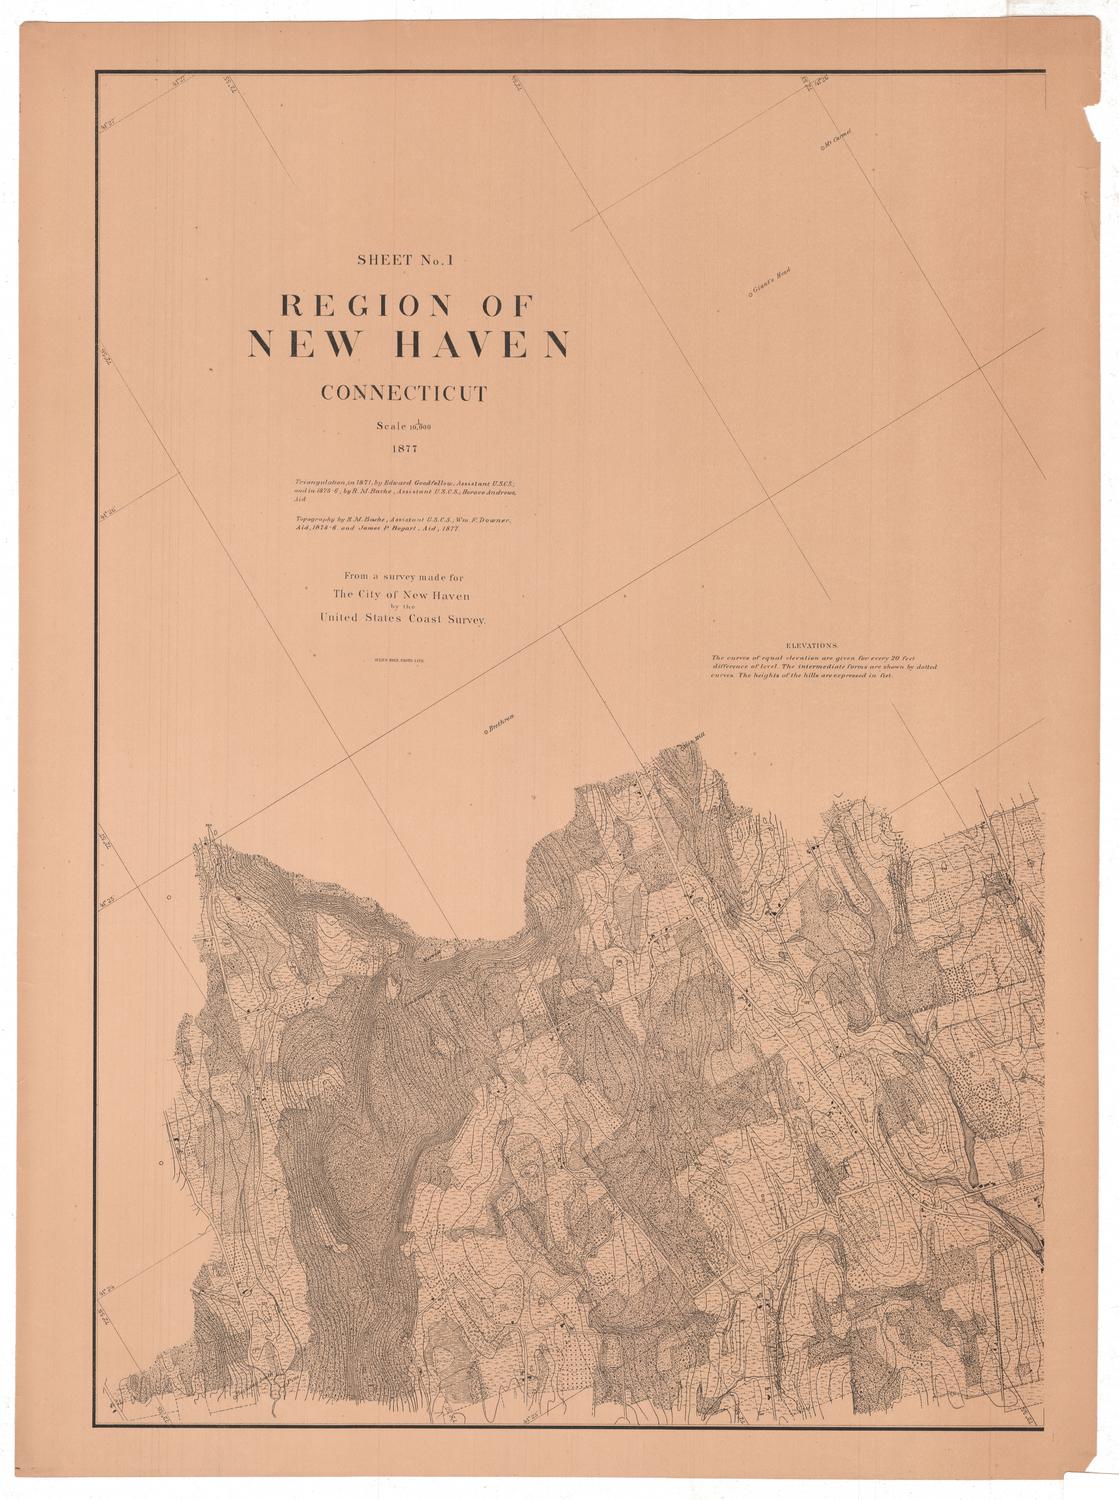
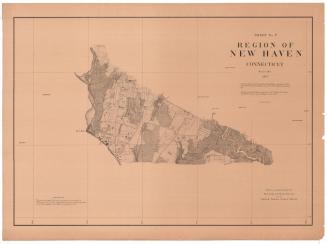
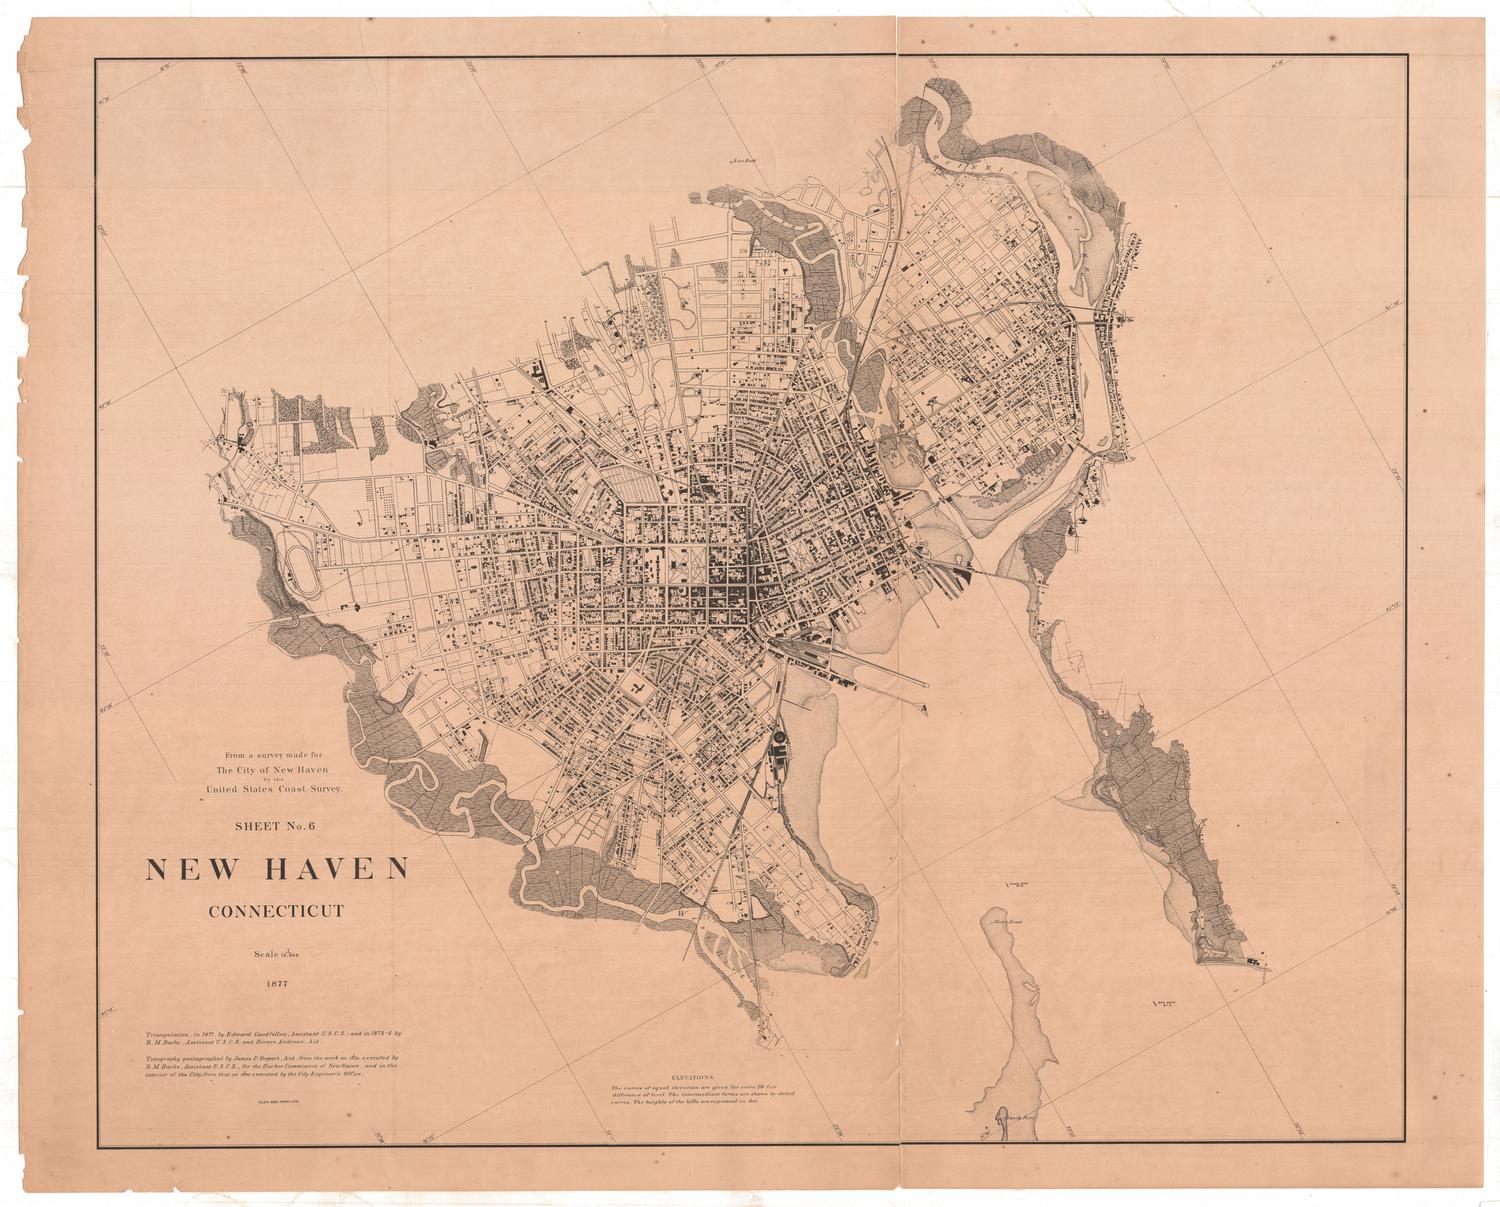
DescriptionSheet 2 of an 11-sheet map of the New Haven, Connecticut, area, primarily conveying the topography, geographical coordinates and different types of land in the area. West Rock Ridge is the main identifying feature of this section, with a river and a road running roughly parallel to the ridge. Land divisions are indicated with dotted lines, and what are presumably roads are indicated with solid parallel lines. Contour lines indicate elevation with the height of the hill provided in feet. Hemlock and Dead Tree are the two areas identified on the land area depicted. Buildings appear to be shown with small rectangular shapes, either shaded or marked with an "x." Additionally, some places beyond the area detailed are provided: Hotchkiss, Quartz Hill, West Rock and Westville, in the case of this map.
Label TextFor this detailed series of maps of the New Haven region, the head of the United States Coast Survey, Richard M. Bache, employed recent graduates of the Sheffield Scientific School, including Horace Andrews and James P. Bogart. This map, showing East Rock Ridge, one of the promiment trap rock ridges overlooking New Haven, makes effective use of contour lines to indicate the steep slope. Contour intervals were quite a new innovation in map making. Most earlier maps made little effort to accurately depict relief.
NotesCartographic Note: Scale: 1:10,000Status
Not on view