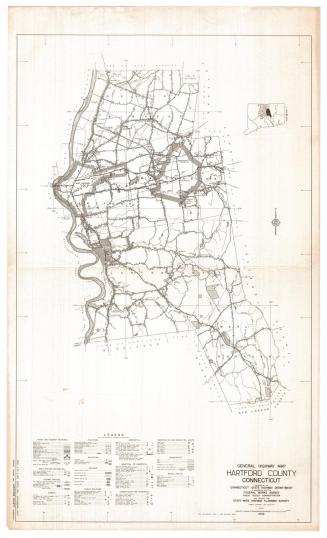
New Map of Hartford and West Hartford, Conn.
PublisherPublished by
Price & Lee Co.
(American)
Dateabout 1955
MediumPhoto offset lithography; black printer's ink on wove paper
DimensionsPrimary Dimensions (front image (a) height x width): 20 x 24 7/8in. (50.8 x 63.2cm)
Primary Dimensions (back image (b) height x width): 23 5/8 x 22 1/8in. (60 x 56.2cm)
Sheet (height x width): 28 x 27in. (71.1 x 68.6cm)
ClassificationsGraphics
Credit LineConnecticut Museum of Culture and History collection
Object number2012.312.217
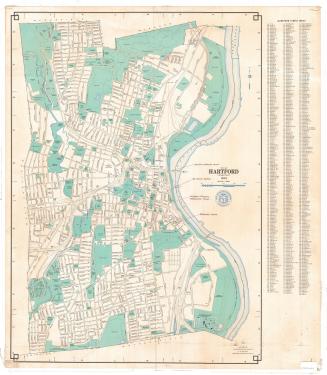
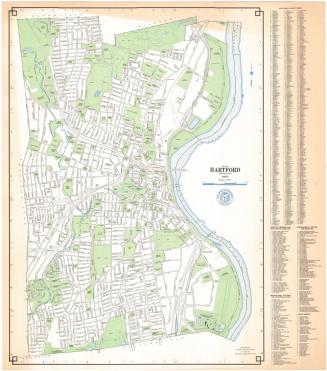
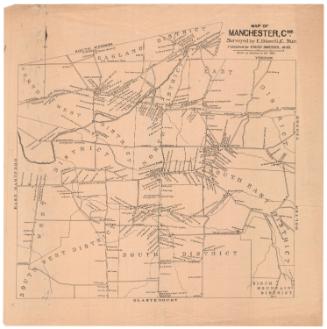
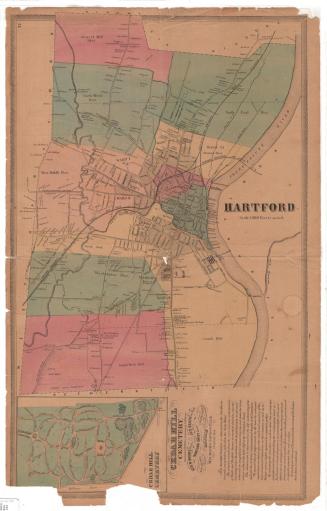
DescriptionTwo-sided map consisting of Hartford and West Hartford on the front (side a), and East Hartford on the back (side b). The map of Hartford and West Hartford extends to the town lines of Bloomfield and Windsor to the north, the Connecticut River and town line of East Hartford to the east, the town lines of Newington and Wethersfield to the south, and the town lines of Farmington and Avon to the west. The map of East Hartford extends from the town line of South Windsor to the north, the town line of Manchester to the east, the town line of Glastonbury to the south, and the Connecticut River and boundary of Hartford to the west.
Both maps have street indexes and show the local roads, bus/trolley routes, steam railroads, parks, hospitals, reservoirs and rivers.
Both maps have street indexes and show the local roads, bus/trolley routes, steam railroads, parks, hospitals, reservoirs and rivers.
Label TextThis map is virtually identical with the New Map of Hartford and West Hartford published by Price & Lee a year earlier. There is some new development in the west and northwest parts of West Hartford, an indication of increasing suburbanization. New roads include Birch Hill Drive, Old Meadow Road, Pochahontas Drive, and Hilldale Road. There is still no direct highway leading rhrough the city and the bus and railroad lines remain prominent. The Park River disappears underground just short of the State Capitol. The impetus to bury the river came from a series of bad floods in the 1930s. 1955 would be another year of bad floods. The map of East Hartford on the other side of the sheet shows a similar pattern of bus routes and railroads, but much less development.
NotesCartographic Note: Scale, front (a): About 2 1/4 inches equals 4000 feet. Scale, back (b): 3 3/8 inches equals 4000 feetStatus
Not on view


R. A. Welcke Offset Co.
probably 1967